28 Jun Summary Analysis: FBI’s 2020 Internet Crime Report
Jonathan L. | Intern
Cybercrime on the Rise
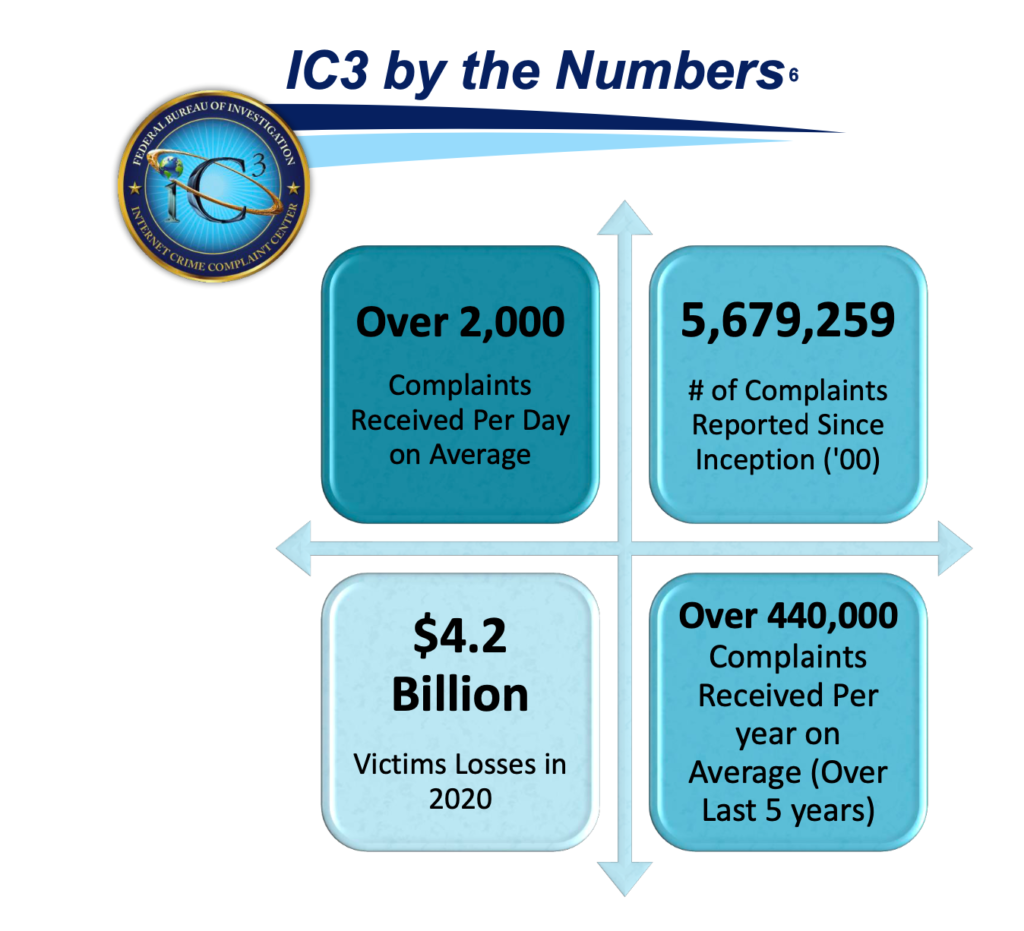
With recent attacks against Colonial Pipeline and a major American meat processor, cyber threats are once again at the forefront of the national news cycle. However, cybercriminal activity extends far beyond the headlines. The Federal Bureau of Investigation is the lead law enforcement agency for investigating cybercrimes and intrusions. As a part of this mission, the FBI began releasing its annual Internet Crime Reportin 2001. The 2020 Internet Crime Report, released in March, details significant rises in cybercrime, monetary losses, and sophistication of attacks in 2019.

Source: FBI, 2020 Internet Crime Report
While cybercrime has been increasing steadily in recent years, 2020 witnessed an alarming spike in malicious activity. According to the Bureau, reported cybercrimes jumped roughly 69% from 2019. This increase in individual crimes also brought a surge in total losses to the tune of $4.2 billion, a 20% increase from 2019. Variation exists between the most common and the most expensive forms of cybercrime. Phishing, non-payment, and extortion crimes represented the three most common forms of cybercrime while business email compromise (BEC), confidence/romance fraud, and investment crimes proved most costly. BEC alone accounted for over $1.8 billion in losses, more than three times that of any other category.
What is Business Email Compromise (BEC)?
BEC attacks are targeted and highly nuanced scams to authorize illegitimate transfers of funds. While BEC attacks can occasionally target individuals (sometimes referred to as an “email account compromise”), the most common and costly iteration of this cybercrime technique targets unsuspecting company employees. By hacking or impersonating the email of a manager or executive, perpetrators attempt to transfer company funds to fraudulent external accounts. According to the FBI’s report, the complexity of this scam technique has expanded over time to include compromise of personal emails, vendor emails, and even spoofed lawyer email accounts.
Age and Cyber Vulnerability
The FBI further categorized its cybercrime data by age group. Ages 30 through 59 suffered similar amounts of cybercrime and monetary loss. In contrast, the 30 and under age block saw the lowest counts in both categories. Individuals 60 and older had the highest propensity of falling victim to cybercrime and suffered the highest total monetary losses. A recent Aspen Institute study also found evidence of cybercriminals disproportionately targeting elderly Americans. This is likely due to the higher vulnerability of older individuals less acquainted with digital technology than their younger, tech-savvy counterparts. However, the FBI does not require age disclosure when submitting a cybercrime report, and therefore age data may be partially incomplete.
Incidents by State
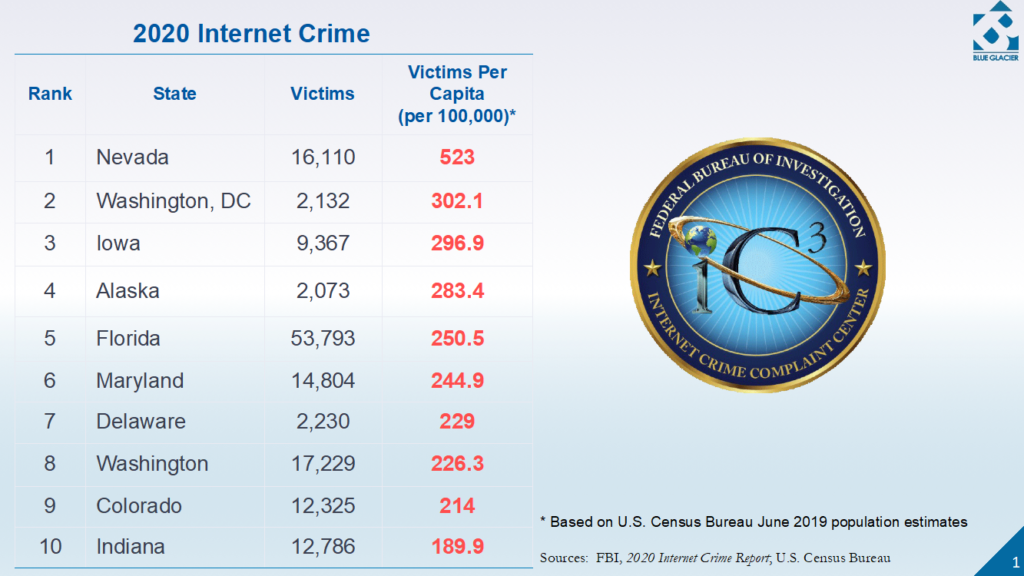
The report also examined cybercrime data by state, with California, Florida, Texas, New York, and Illinois experiencing the most reported total cybercrimes. Total resulting monetary losses followed a similar pattern with California, New York, Texas, Florida, and Ohio claiming the top five spots. After adjusting for population size, the data tells somewhat of a different story.

In terms of victims per capita: Nevada, the District of Columbia, Iowa, Alaska, and Florida hold the top five spots. For per capita monetary losses: North Dakota, the District of Columbia, New York, Missouri, and Colorado saw the highest costs.
International Victims

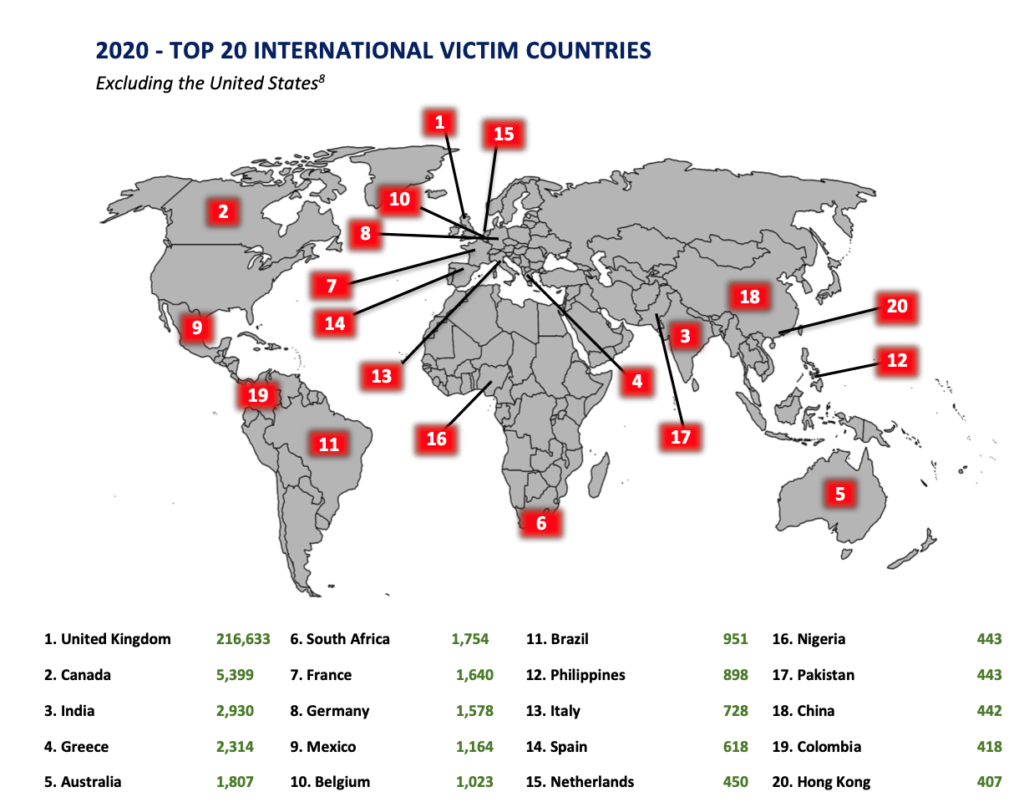
Source: FBI, 2020 Internet Crime Report
The United States reported the most incidents of cybercrime in 2020 by an overwhelming margin—more than three times that of the next highest nation. Afer the U.S., the United Kingdom, Canada, India, Greece, and Australia reported the most cybercrime. It remains unclear from the data how much of the separation between U.S. and other countries is due to differences in reporting practices.
Cybercrime and COVID-19
The rising cybercrime documented in the report is likely related to increased internet traffic brought on by the COVID-19 pandemic. Overall web volume swelled dramatically during the global lockdowns, with some estimates putting the jump as high as 70%. As internet traffic increased so too did cybercriminal activity, with total cybercrimes up 69% around the same period. With the increasing pervasiveness of digital transactions, more individuals world-wide—and particularly in the United Sates—could be at risk of becoming victims. Cybercrime sophistication also appears to be on the rise. The days of simplistic “Nigerian prince” email phishing scams may be waning as a number of recent attacks showcased striking levels of specialization. For example, 2020 saw a rash of cyber scams specifically targeting the Coronavirus Aid, Relief, and Economic Security (CARES) Act stimulus payouts as well as Paycheck Protection Program (PPP) loans. Victims in multiple states also reported fraudulent online COVID-related unemployment filings in their name. The damage of these and similar claims was two-fold: not only did the cybercriminals defraud the U.S. government, but victims were also delayed or barred entirely from accessing crucial benefits.
The Dangers of Ransomware
The FBI Computer Crime Center reported ransomware-related losses of roughly $29.1 million in 2020. In comparison to other types of cybercrime listed by the FBI, this number stands relatively low. However, due to the increasing use of this attack method against high-profile targets, the FBI’s report specifically highlights the dangers of ransomware. Some attacks of note include the hacking of Sony Pictures Entertainment in 2014 as well as the aforementioned attacks on global meat processors and Colonial Pipeline in early 2021. Ransomware hacks begin with the instillation of malware, a malicious form of software, onto a victim’s computer system. This infiltration can take many forms: malicious email links, stolen user credentials, or even uploads via USB drives. Once in place, ransomware encrypts user data and renders the system inoperative. After the data is locked, criminal actors hold the data hostage until some form of ransom is paid—often in the form of cryptocurrency. Should a victim refuse to pay ransom the cybercriminal may threaten to delete or publicly leak the data in question.
Origins of Future Threats
The FBI’s report left a key area open to further research. Notably, the data does not include nation of origin information. In light of this, it remains unclear as to whether the majority of perpetrators reside in foreign nations or inside the United States. Experts have long warned of the cybercrime threat stemming from several American adversaries, particularly Russia and China. While the Bureau could not prosecute most foreign cybercriminals, the U.S. could attempt to name and shame offender nations. This sort of political pressure may incentivize other countries to strengthen their domestic cyber law enforcement practices. However, due to the illusive nature of criminals operating in the digital domain, such detailed data may be difficult or impossible to compile.
Conclusion
The digital world is here to stay—and growing rapidly. As cyberspace expands, so too does the potential for malicious internet activity. With the volume and complexity of cybercrimes on the rise, individuals should use diligence and adhere to the FBI’s official Simple Steps for Internet Safety when navigating online.
2020 U.S. Cyber Victims by State*
| Rank | State | Victims Per Capita (100,000) |
| 1 | Nevada | 523.0 |
| 2 | District of Columbia | 302.1 |
| 3 | Iowa | 296.9 |
| 4 | Alaska | 283.4 |
| 5 | Florida | 250.5 |
| 6 | Maryland | 244.9 |
| 7 | Delaware | 229.0 |
| 8 | Washington | 226.3 |
| 9 | Colorado | 214.0 |
| 10 | Indiana | 189.9 |
| 11 | Arizona | 178.7 |
| 12 | New York | 177.4 |
| 13 | California | 176.0 |
| 14 | New Jersey | 167.0 |
| 15 | Massachusetts | 166.4 |
| 16 | New Mexico | 163.4 |
| 17 | Oregon | 161.6 |
| 18 | Virginia | 161.3 |
| 19 | Illinois | 159.3 |
| 20 | Rhode Island | 158.3 |
| 21 | Connecticut | 158.1 |
| 22 | Wyoming | 157.8 |
| 23 | Utah | 153.7 |
| 24 | Kentucky | 152.5 |
| 25 | New Hampshire | 148.2 |
| 26 | Pennsylvania | 145.6 |
| 27 | Wisconsin | 142.7 |
| 28 | Arkansas | 140.4 |
| 29 | Hawaii | 139.7 |
| 30 | Vermont | 137.2 |
| 31 | Texas | 133.3 |
| 32 | Missouri | 133.0 |
| 33 | Montana | 127.7 |
| 34 | Georgia | 126.2 |
| 35 | Michigan | 125.4 |
| 36 | Tennessee | 124.9 |
| 37 | Maine | 124.4 |
| 38 | Idaho | 123.6 |
| 39 | Minnesota | 121.4 |
| 40 | Oklahoma | 120.9 |
| 41 | Kansas | 118.7 |
| 42 | Alabama | 118.4 |
| 43 | North Carolina | 116.5 |
| 44 | Ohio | 114.8 |
| 45 | South Carolina | 113.7 |
| 46 | Nebraska | 112.0 |
| 47 | Louisiana | 109.2 |
| 48 | West Virginia | 106.1 |
| 49 | North Dakota | 99.7 |
| 50 | South Dakota | 87.8 |
| 51 | Mississippi | 83.3 |
2020 U.S. Cyber Losses by State*
| Rank | State | Losses Per Capita (100,000) |
| 1 | North Dakota | $ 3,386,199.55 |
| 2 | District of Columbia | $ 2,684,059.35 |
| 3 | New York | $ 2,137,464.28 |
| 4 | Missouri | $ 1,888,634.52 |
| 5 | Colorado | $ 1,748,020.69 |
| 6 | California | $ 1,572,810.32 |
| 7 | Utah | $ 1,469,574.65 |
| 8 | Ohio | $ 1,455,817.39 |
| 9 | Nevada | $ 1,440,948.19 |
| 10 | Massachusetts | $ 1,415,795.58 |
| 11 | Florida | $ 1,373,668.13 |
| 12 | Virginia | $ 1,191,041.86 |
| 13 | Illinois | $ 1,187,648.39 |
| 14 | Connecticut | $ 1,158,722.93 |
| 15 | Washington | $ 1,155,896.14 |
| 16 | New Mexico | $ 1,139,987.76 |
| 17 | New Jersey | $ 1,111,517.01 |
| 18 | Texas | $ 1,081,412.99 |
| 19 | Minnesota | $ 1,034,496.54 |
| 20 | Maryland | $ 1,033,352.63 |
| 21 | Alaska | $ 1,003,730.87 |
| 22 | Arizona | $ 990,952.62 |
| 23 | Hawaii | $ 965,590.89 |
| 24 | Georgia | $ 930,192.98 |
| 25 | Oregon | $ 910,196.68 |
| 26 | Wyoming | $ 880,626.31 |
| 27 | Pennsylvania | $ 847,573.01 |
| 28 | Michigan | $ 841,099.88 |
| 29 | Rhode Island | $ 723,990.22 |
| 30 | Iowa | $ 678,168.82 |
| 31 | Vermont | $ 669,210.35 |
| 32 | Delaware | $ 666,138.51 |
| 33 | North Carolina | $ 661,790.58 |
| 34 | Kansas | $ 657,577.21 |
| 35 | Idaho | $ 653,062.42 |
| 36 | Wisconsin | $ 619,700.99 |
| 37 | Nebraska | $ 609,987.14 |
| 38 | Mississippi | $ 608,562.88 |
| 39 | Tennessee | $ 588,528.22 |
| 40 | Arkansas | $ 575,634.30 |
| 41 | Louisiana | $ 574,728.16 |
| 42 | Alabama | $ 561,862.48 |
| 43 | Montana | $ 530,446.27 |
| 44 | Maine | $ 526,201.22 |
| 45 | Oklahoma | $ 524,357.95 |
| 46 | Indiana | $ 522,563.29 |
| 47 | South Carolina | $ 490,316.18 |
| 48 | New Hampshire | $ 363,996.17 |
| 49 | South Dakota | $ 362,652.84 |
| 50 | Kentucky | $ 281,819.73 |
| 51 | West Virginia | $ 269,162.41 |
No Comments